How to use
Get started!
The colourful map is interactive: hover over, click on it, use filters to find areas that fit your criteria. Here are a few pointers to start you off:
Main app interactions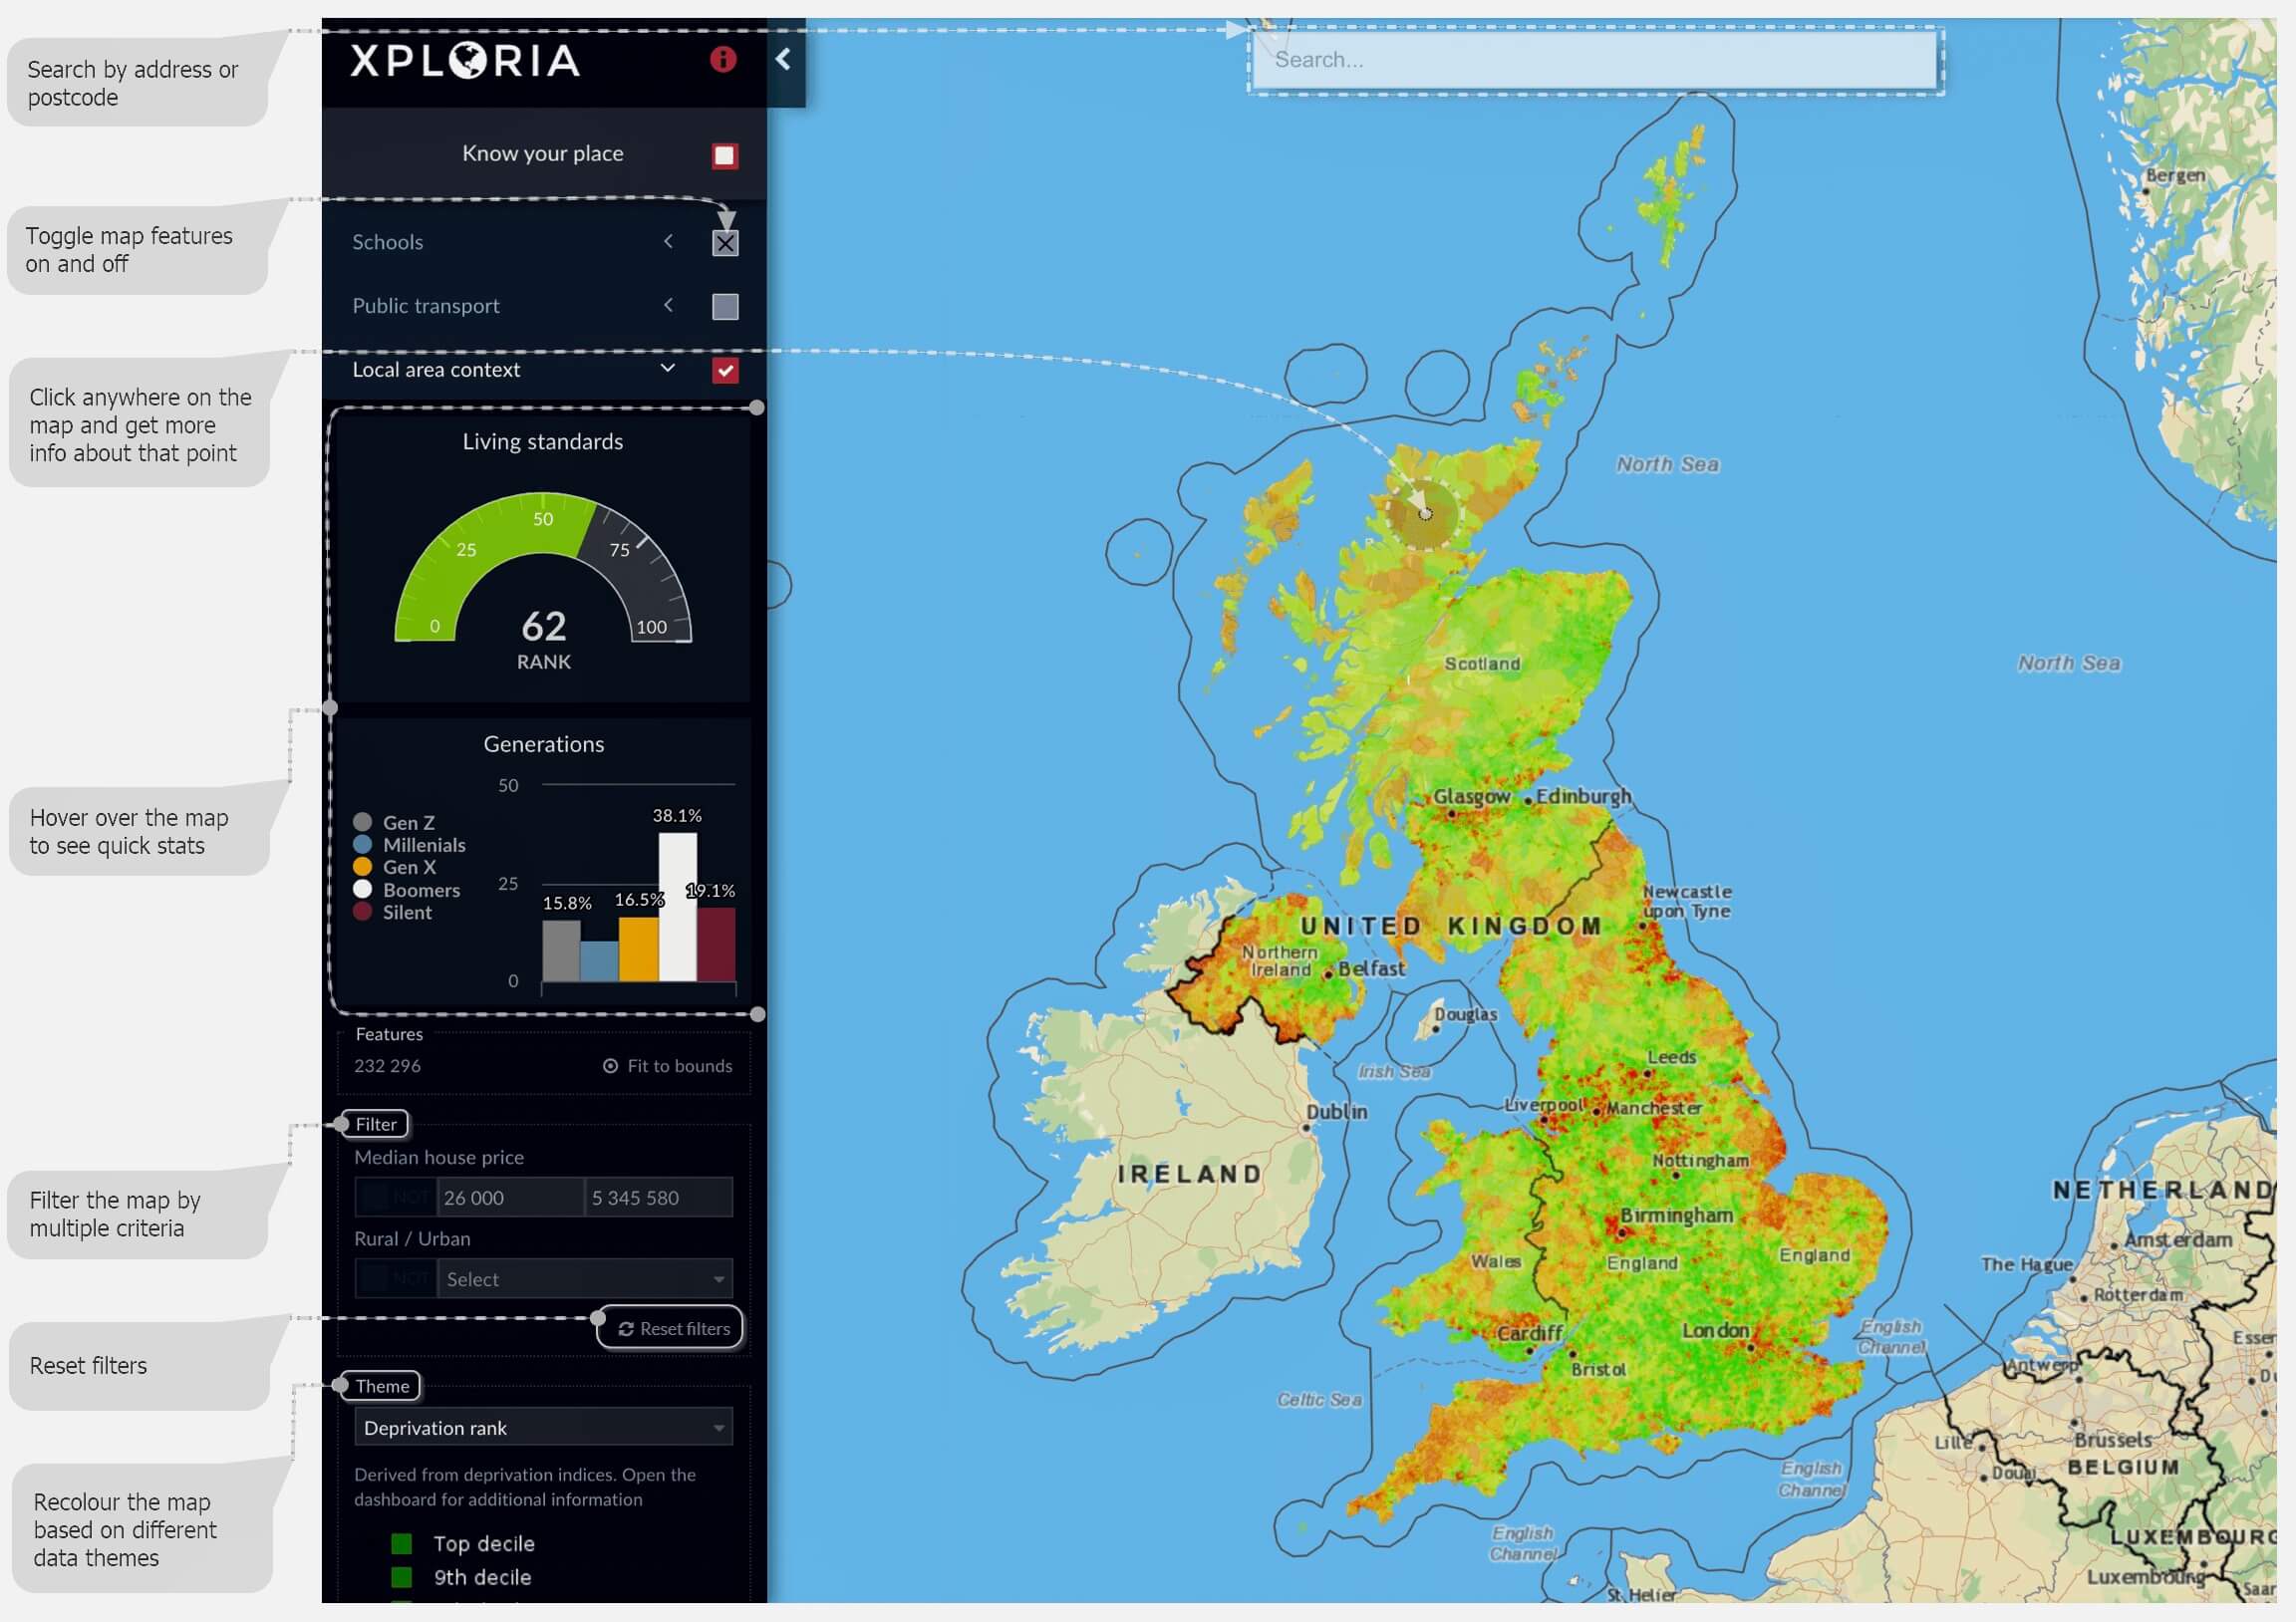
Map interaction examples
Now if you want to really get down to business, read on. Unless you want to go straight to the app , that is.
Toggle layers on and off and filter the map
Each layer in the app, Local area context, Schools, Public transport, can be removed from the map. Toggle layers on to be able to filter them, the layer appears on the map.
Filter the map to search for areas that fit your criteria and budget. For example, if you are searching for an affordable urban area with low crime, median house prices up to 400k and fast internet:
- Use map price filter and enter your maximum medium price;
- Select Urban from the Rural /Urban filter;
- Change the context layer theme to “Crime rank” (this colours the map according to crime rate) and use the legend to select only the top 5 deciles for crime level;
- Switch to broadband speed theme and select all speeds above 60mbps.
The map shows only the areas that fit your criteria, even some parts of London appear to be affordable!
Filter the map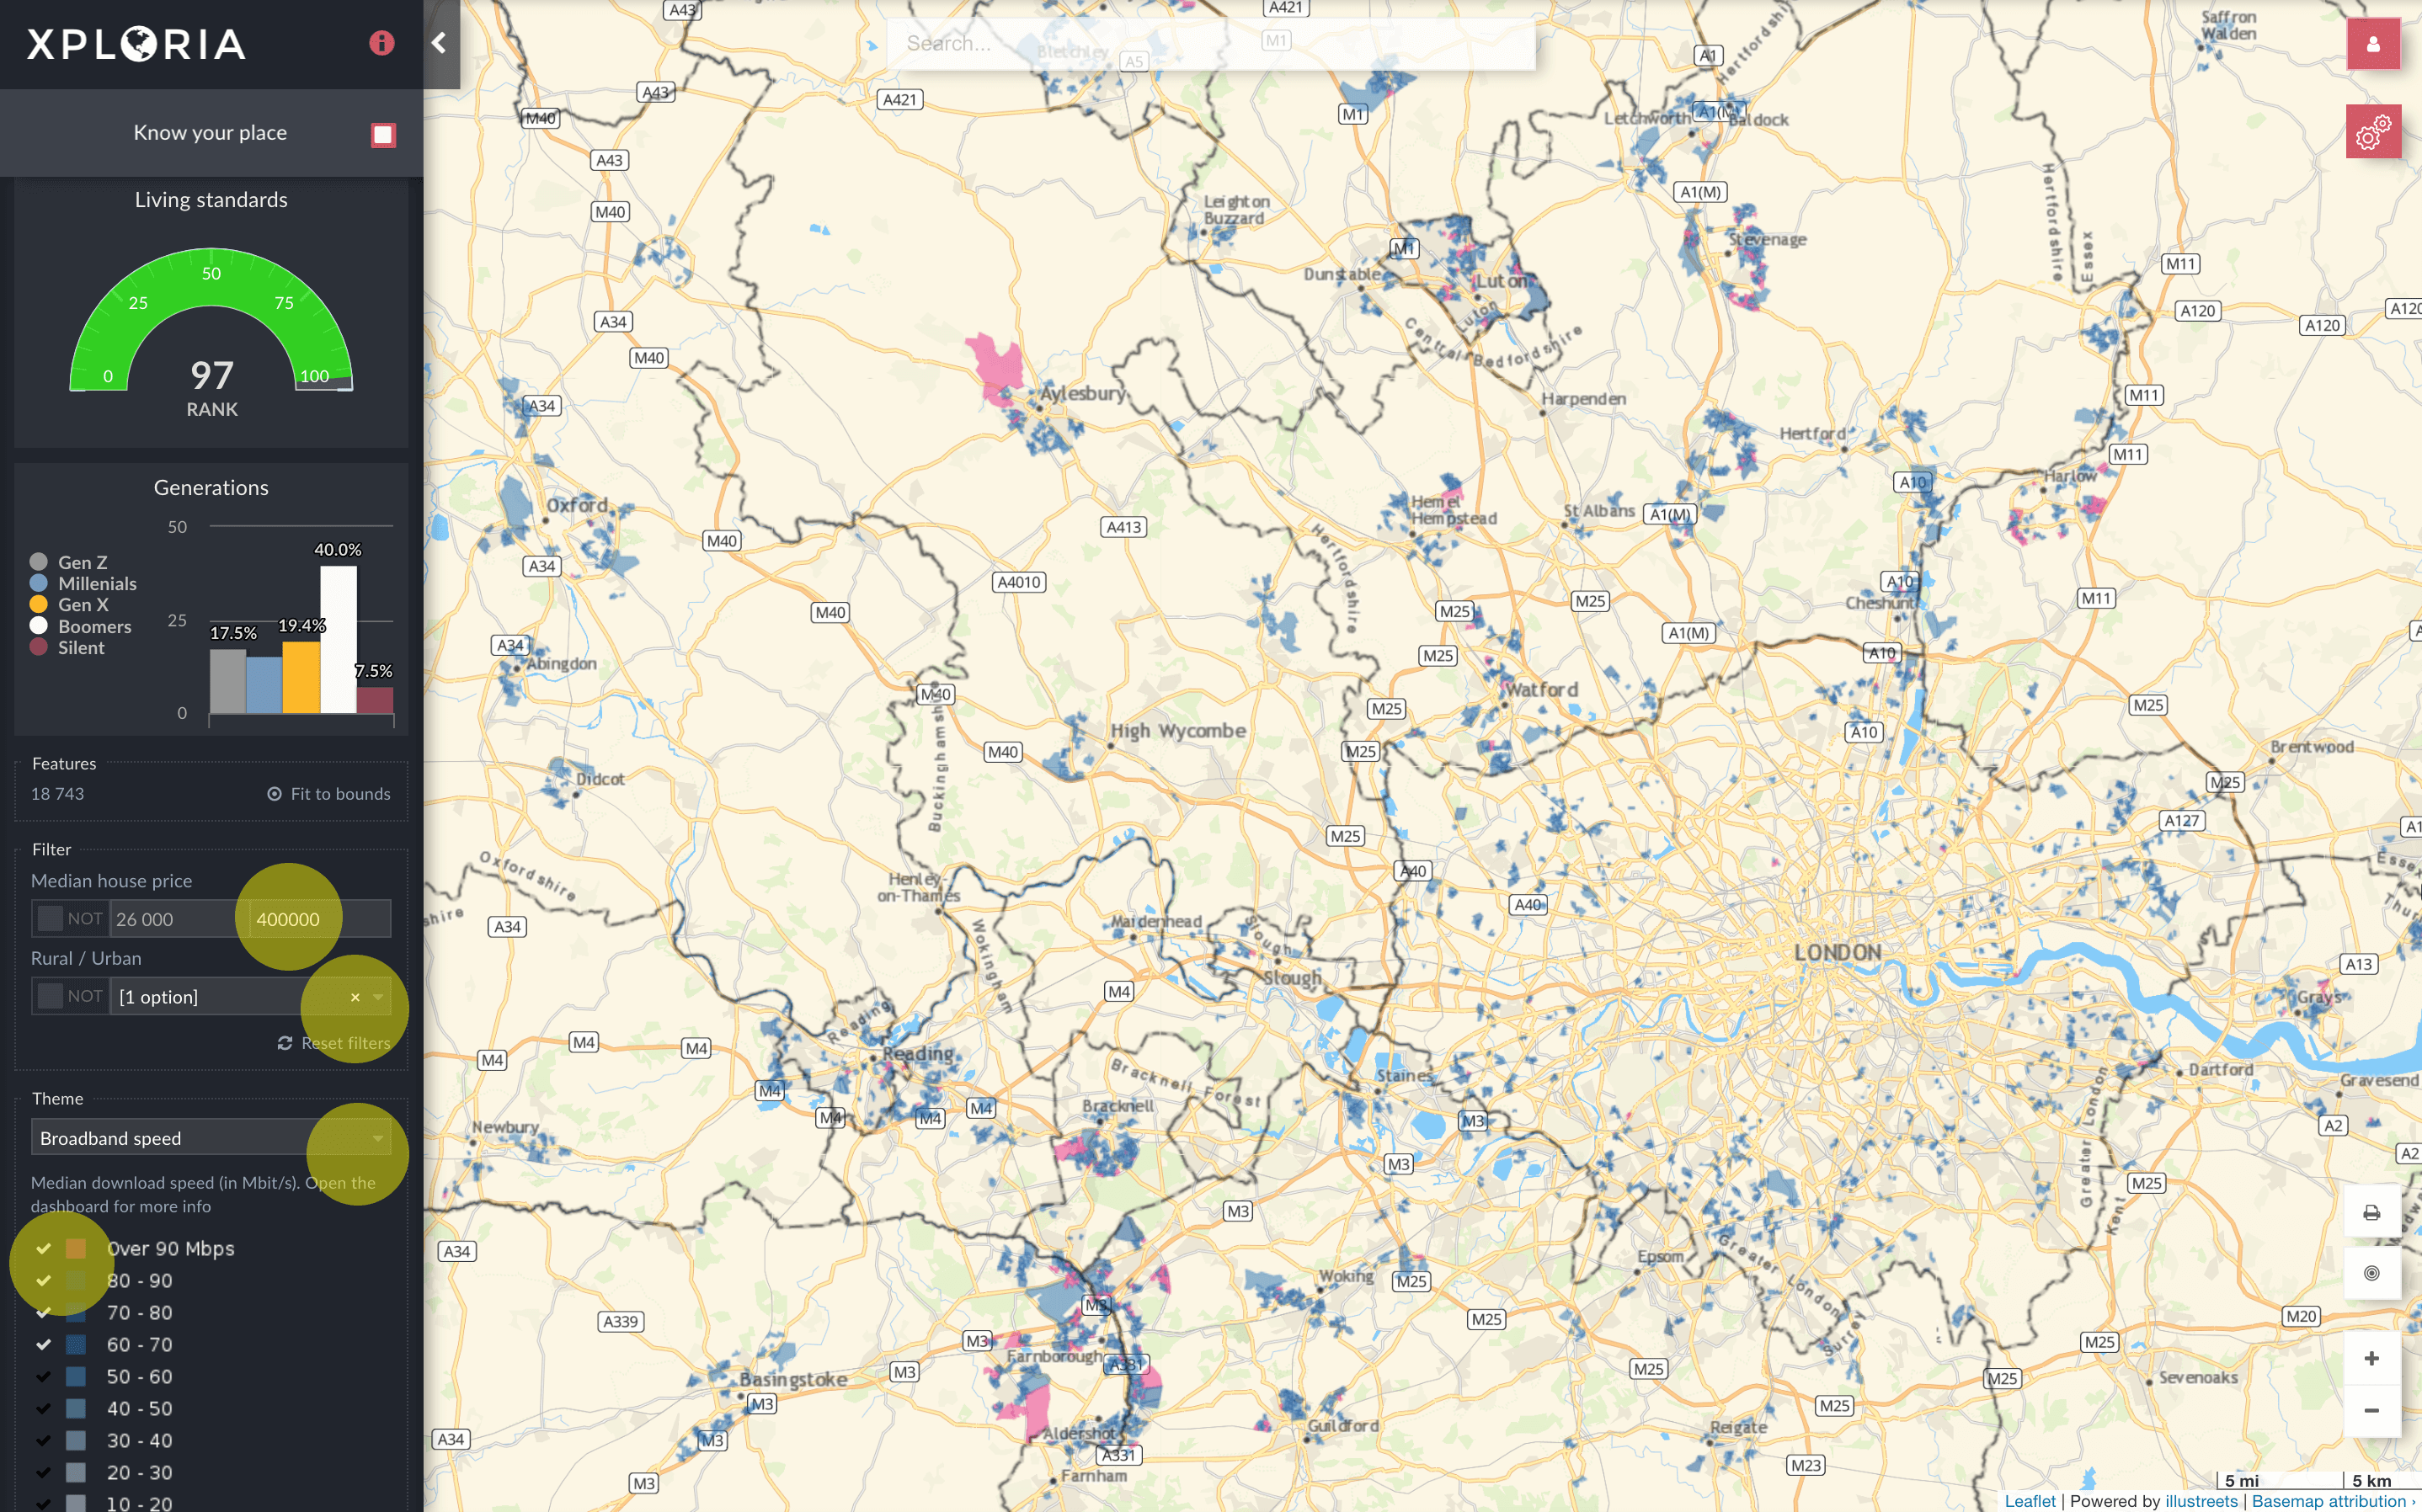
Click on the map
To get detailed information about any street in the UK, click on the map! A pop-up dashboard will appear.
Pop-up dashboard
Estimate travel time
Enable public transport layer and click on a rail/tube station to view areas accessible from this station. Use the left-hand panel filters to switch between 15, 30, 45 and 60 minutes travel time from the station clicked. The train/tube stations reacheable are shown on the map, click on them to find out their name.
Get travel time
Location dashboard
Explore local area stats, house prices, crime rate, nearby amenities such as pubs, supermarkets, parks, playgrounds, open green spaces, and schools, noise pollution from roads and railways. For detailed information about the data see Data sources.
Area overview
Area overview tab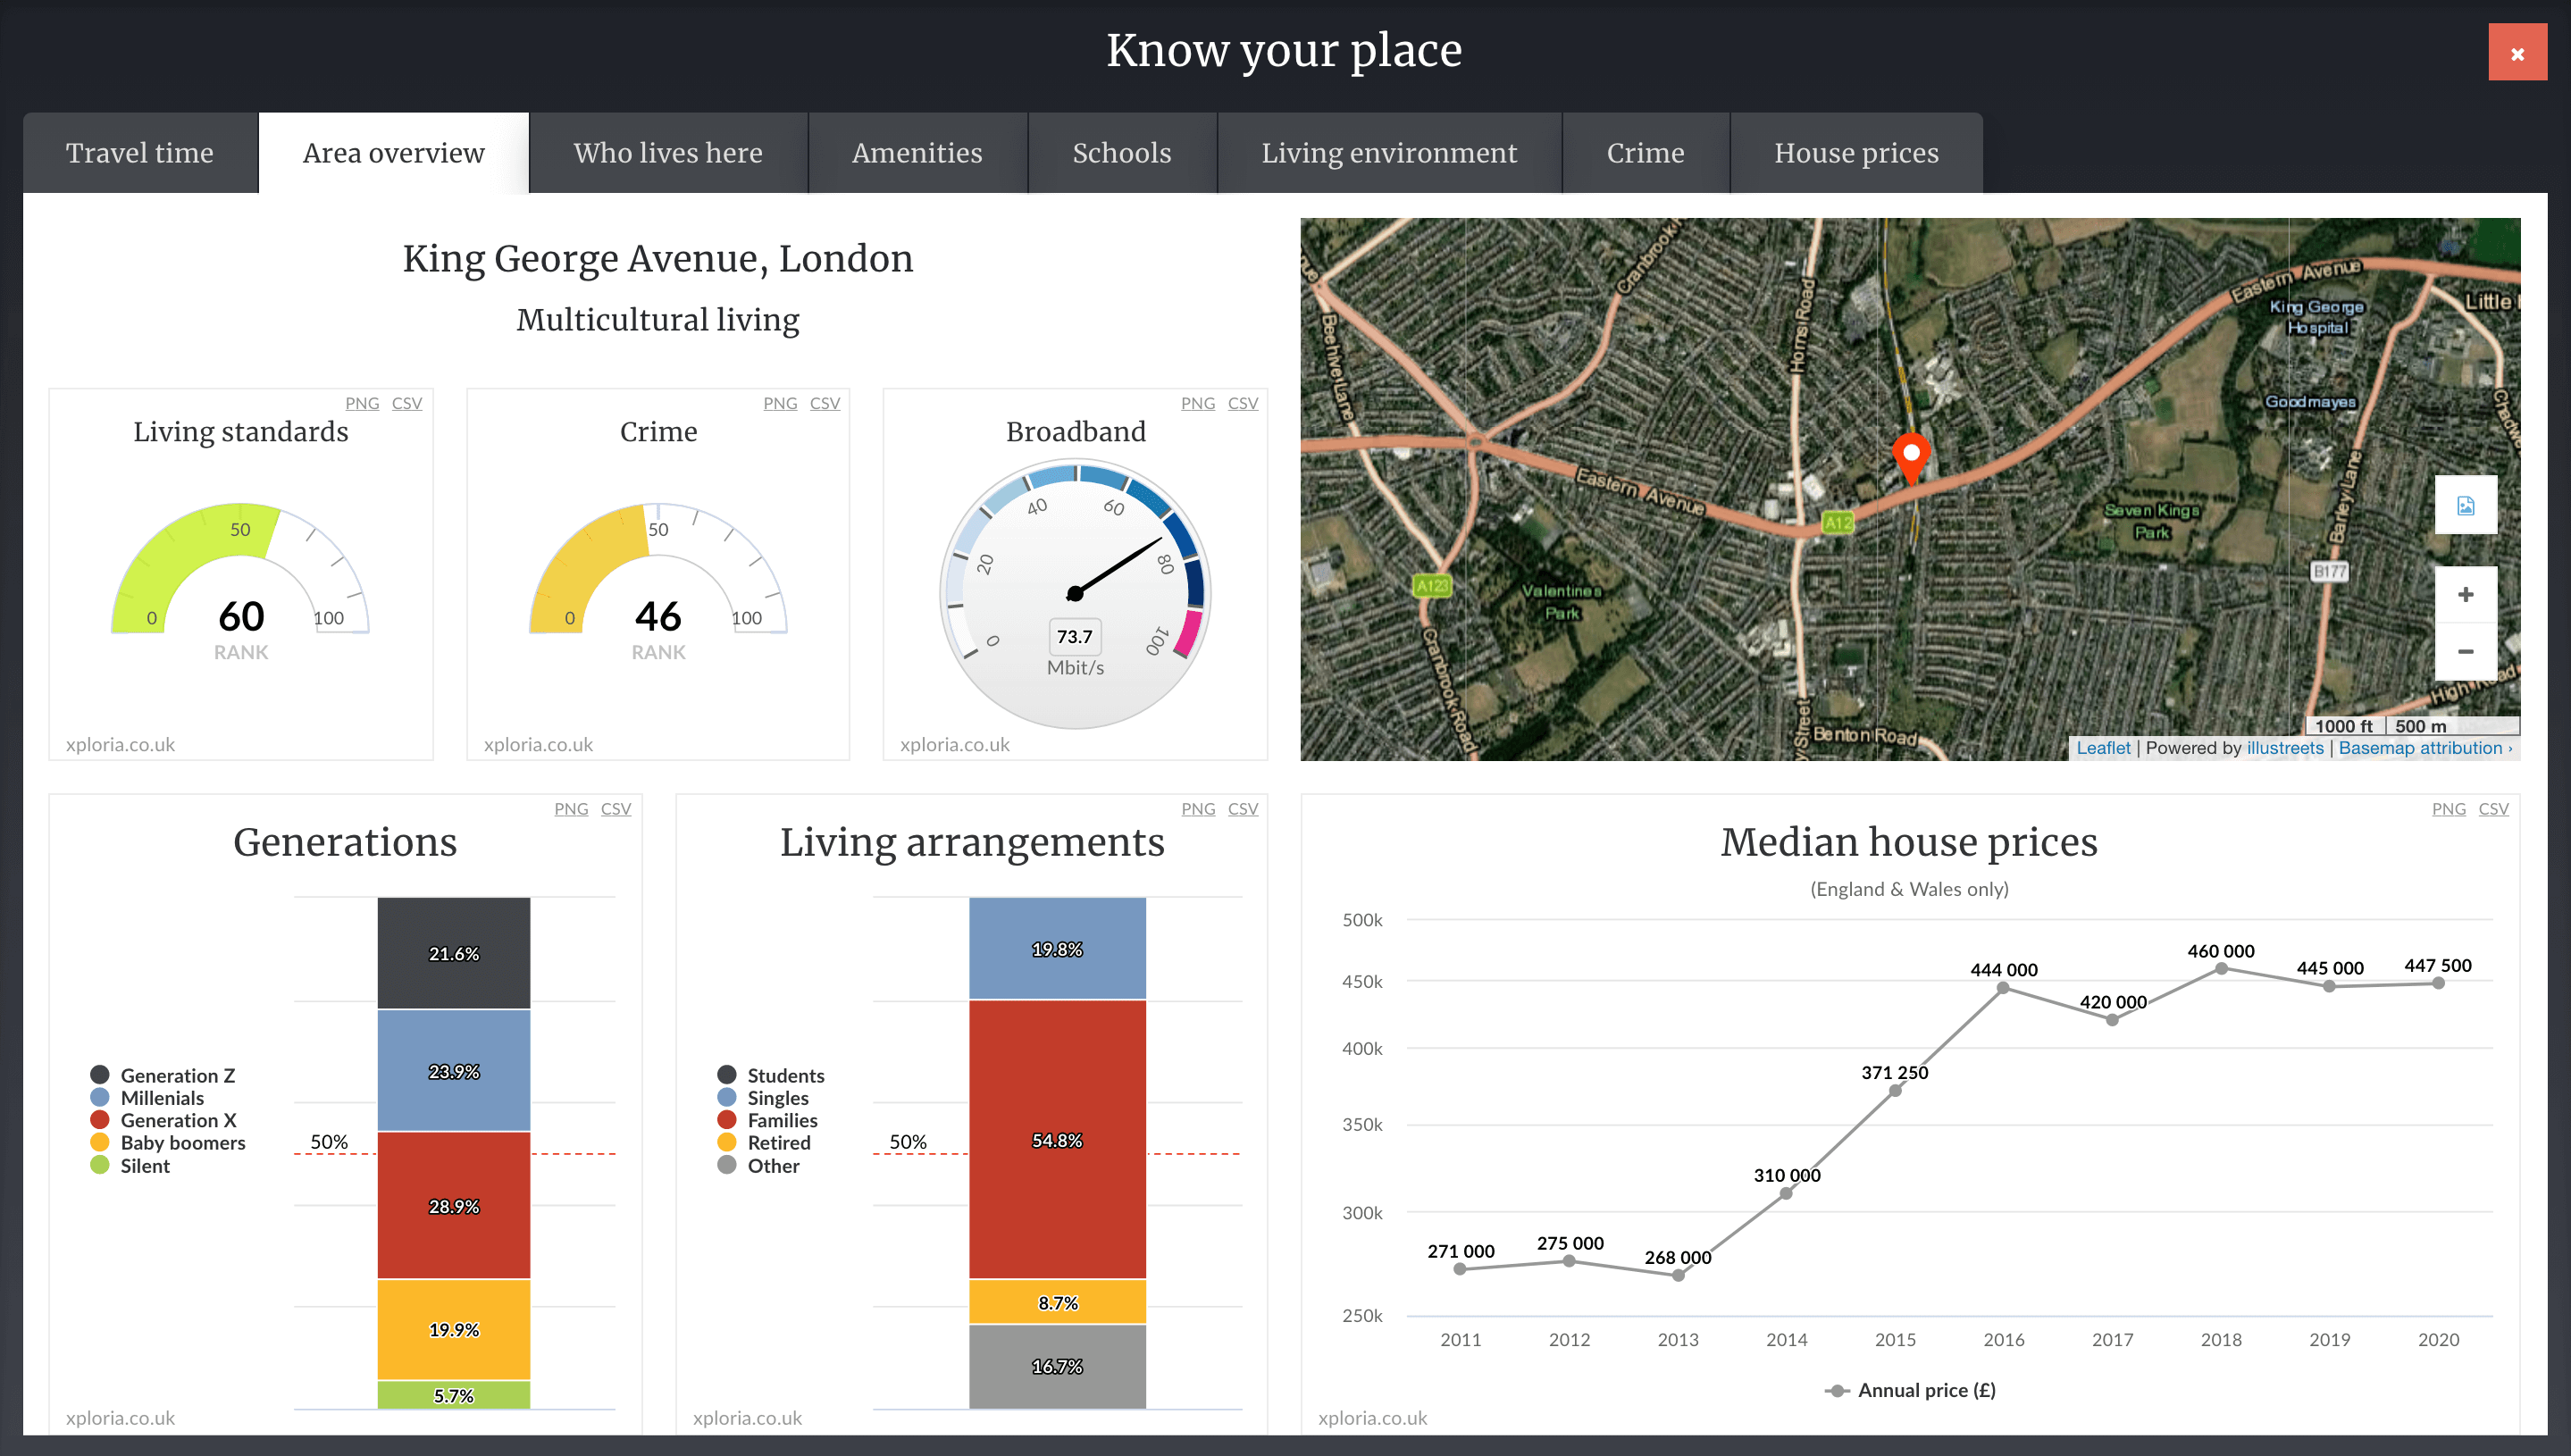
Who lives here
A selection of demographics data about local population at a small area level, represented by the shape on the main map.
Demographics tab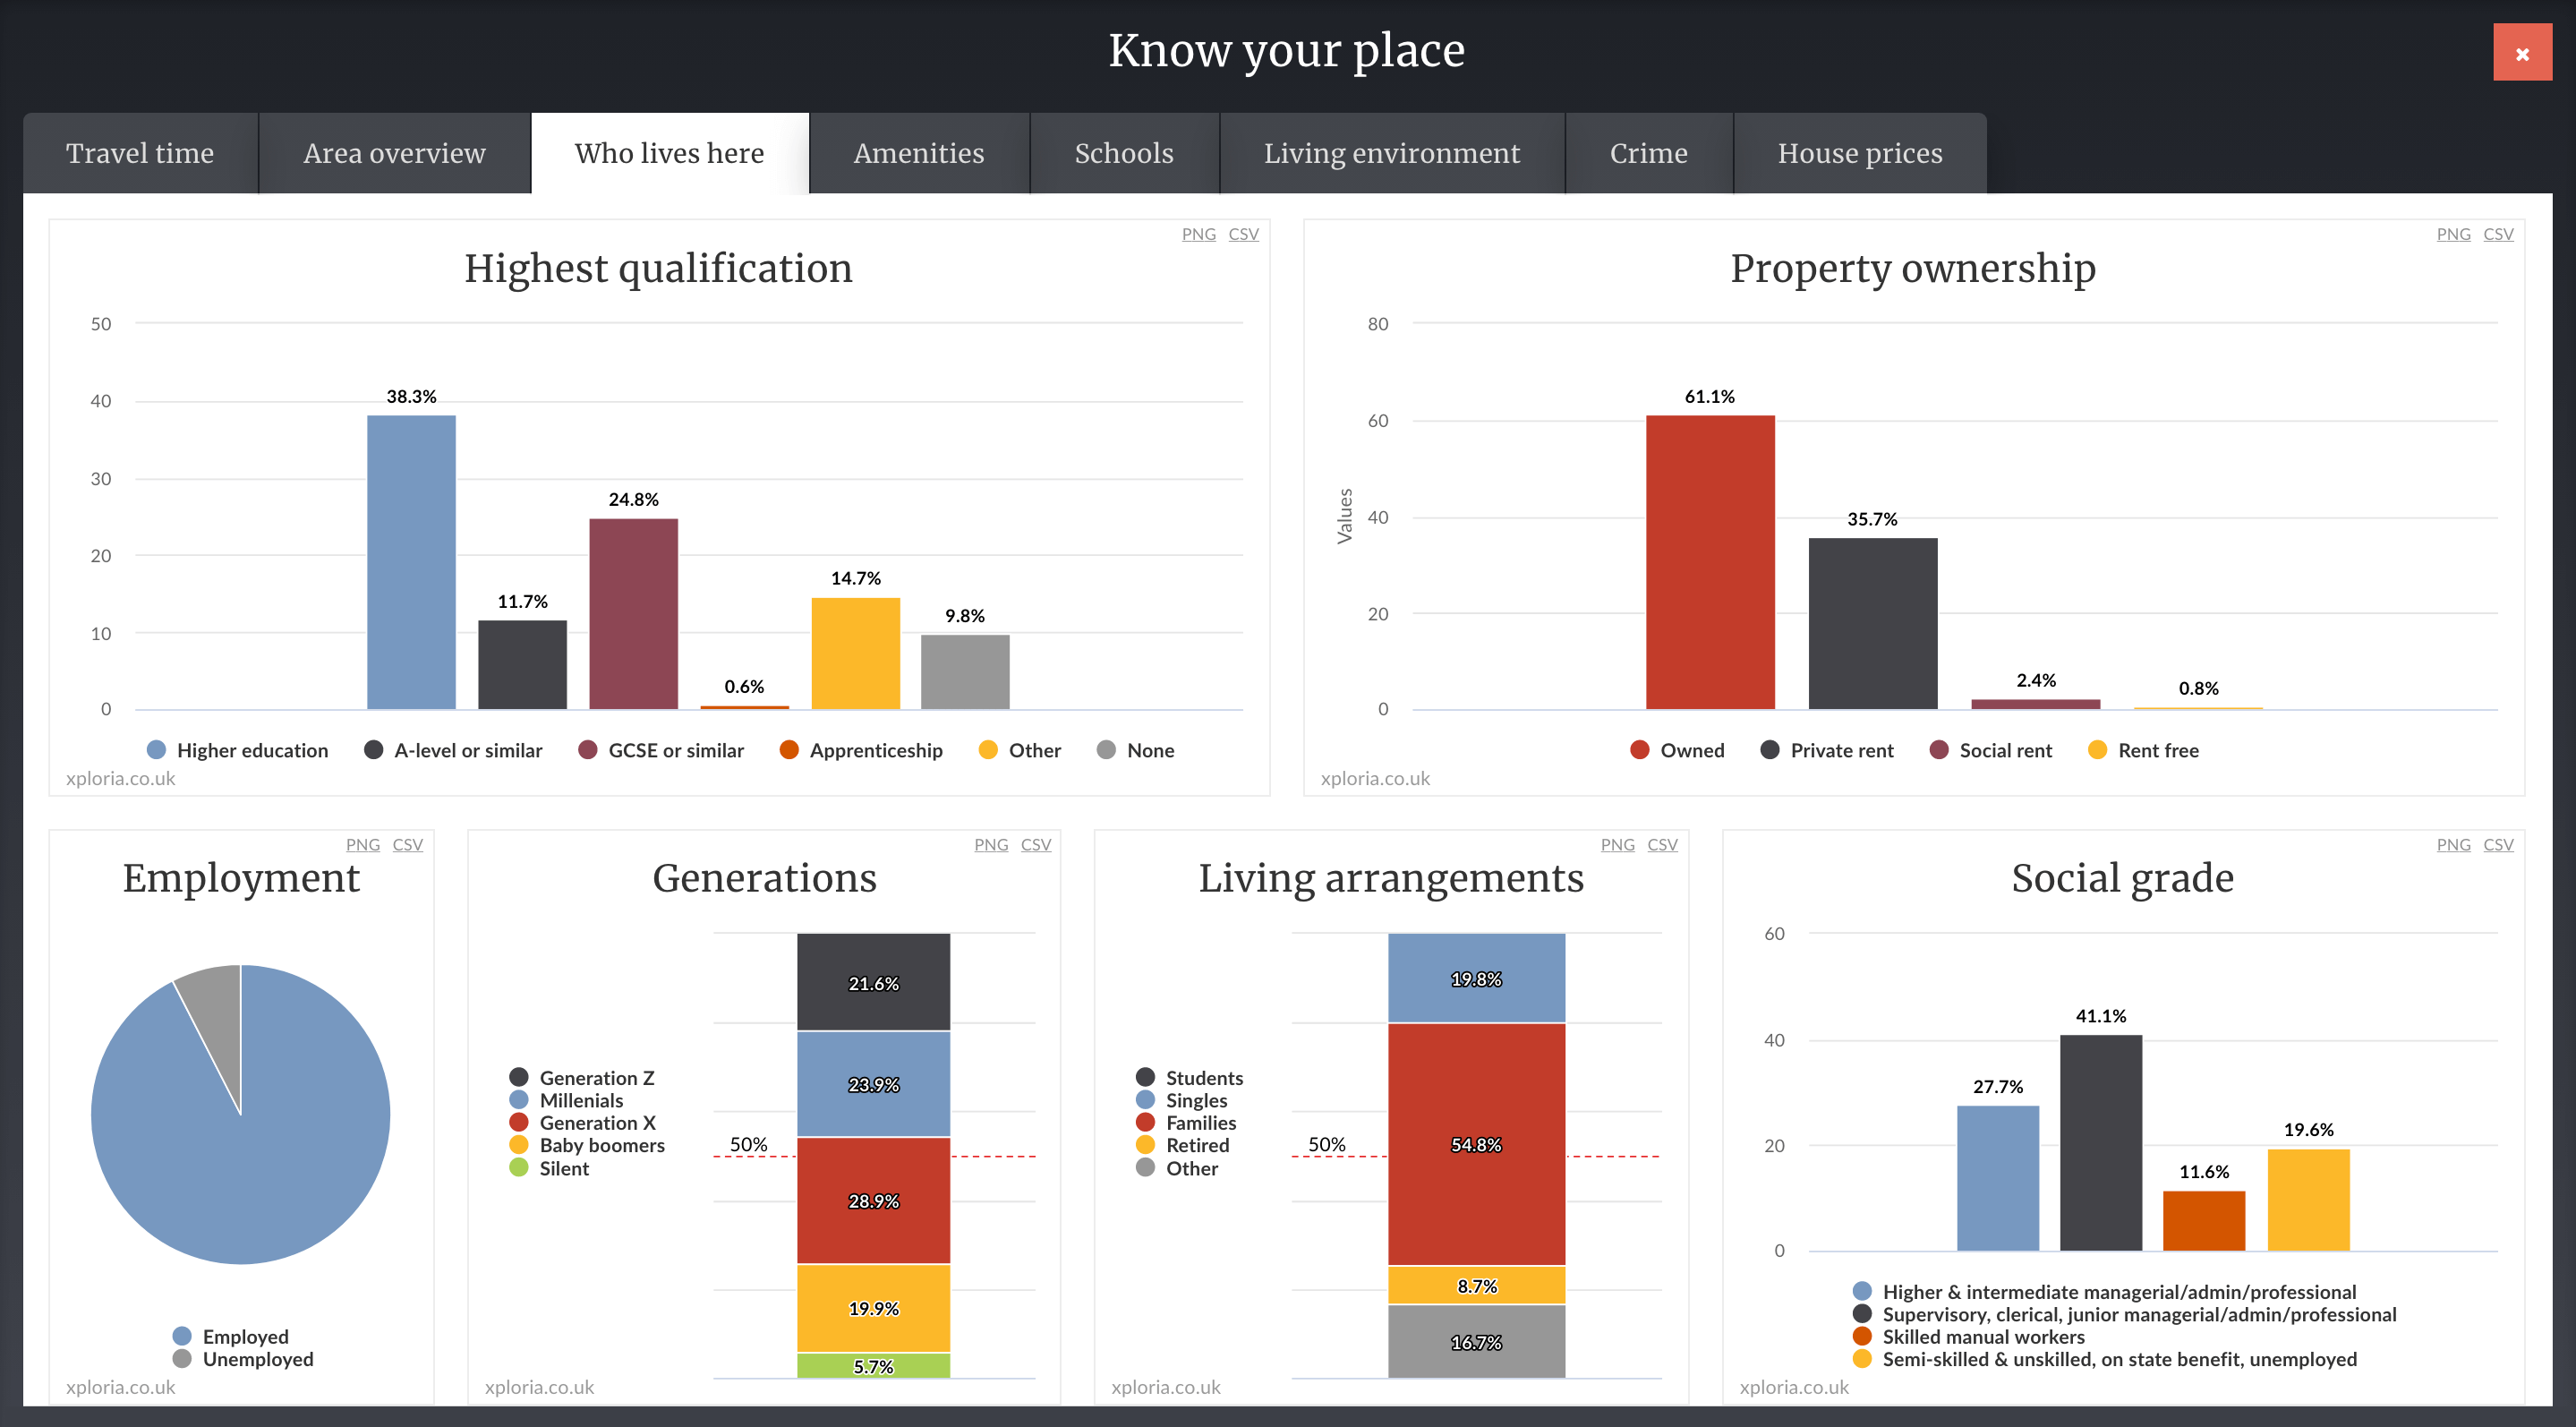
Amenities
- Toggle groups of amenities on and off using the checkboxes on the left-side panel.
- Change distance to show amenities nearby, by walking or driving.
Amenities tab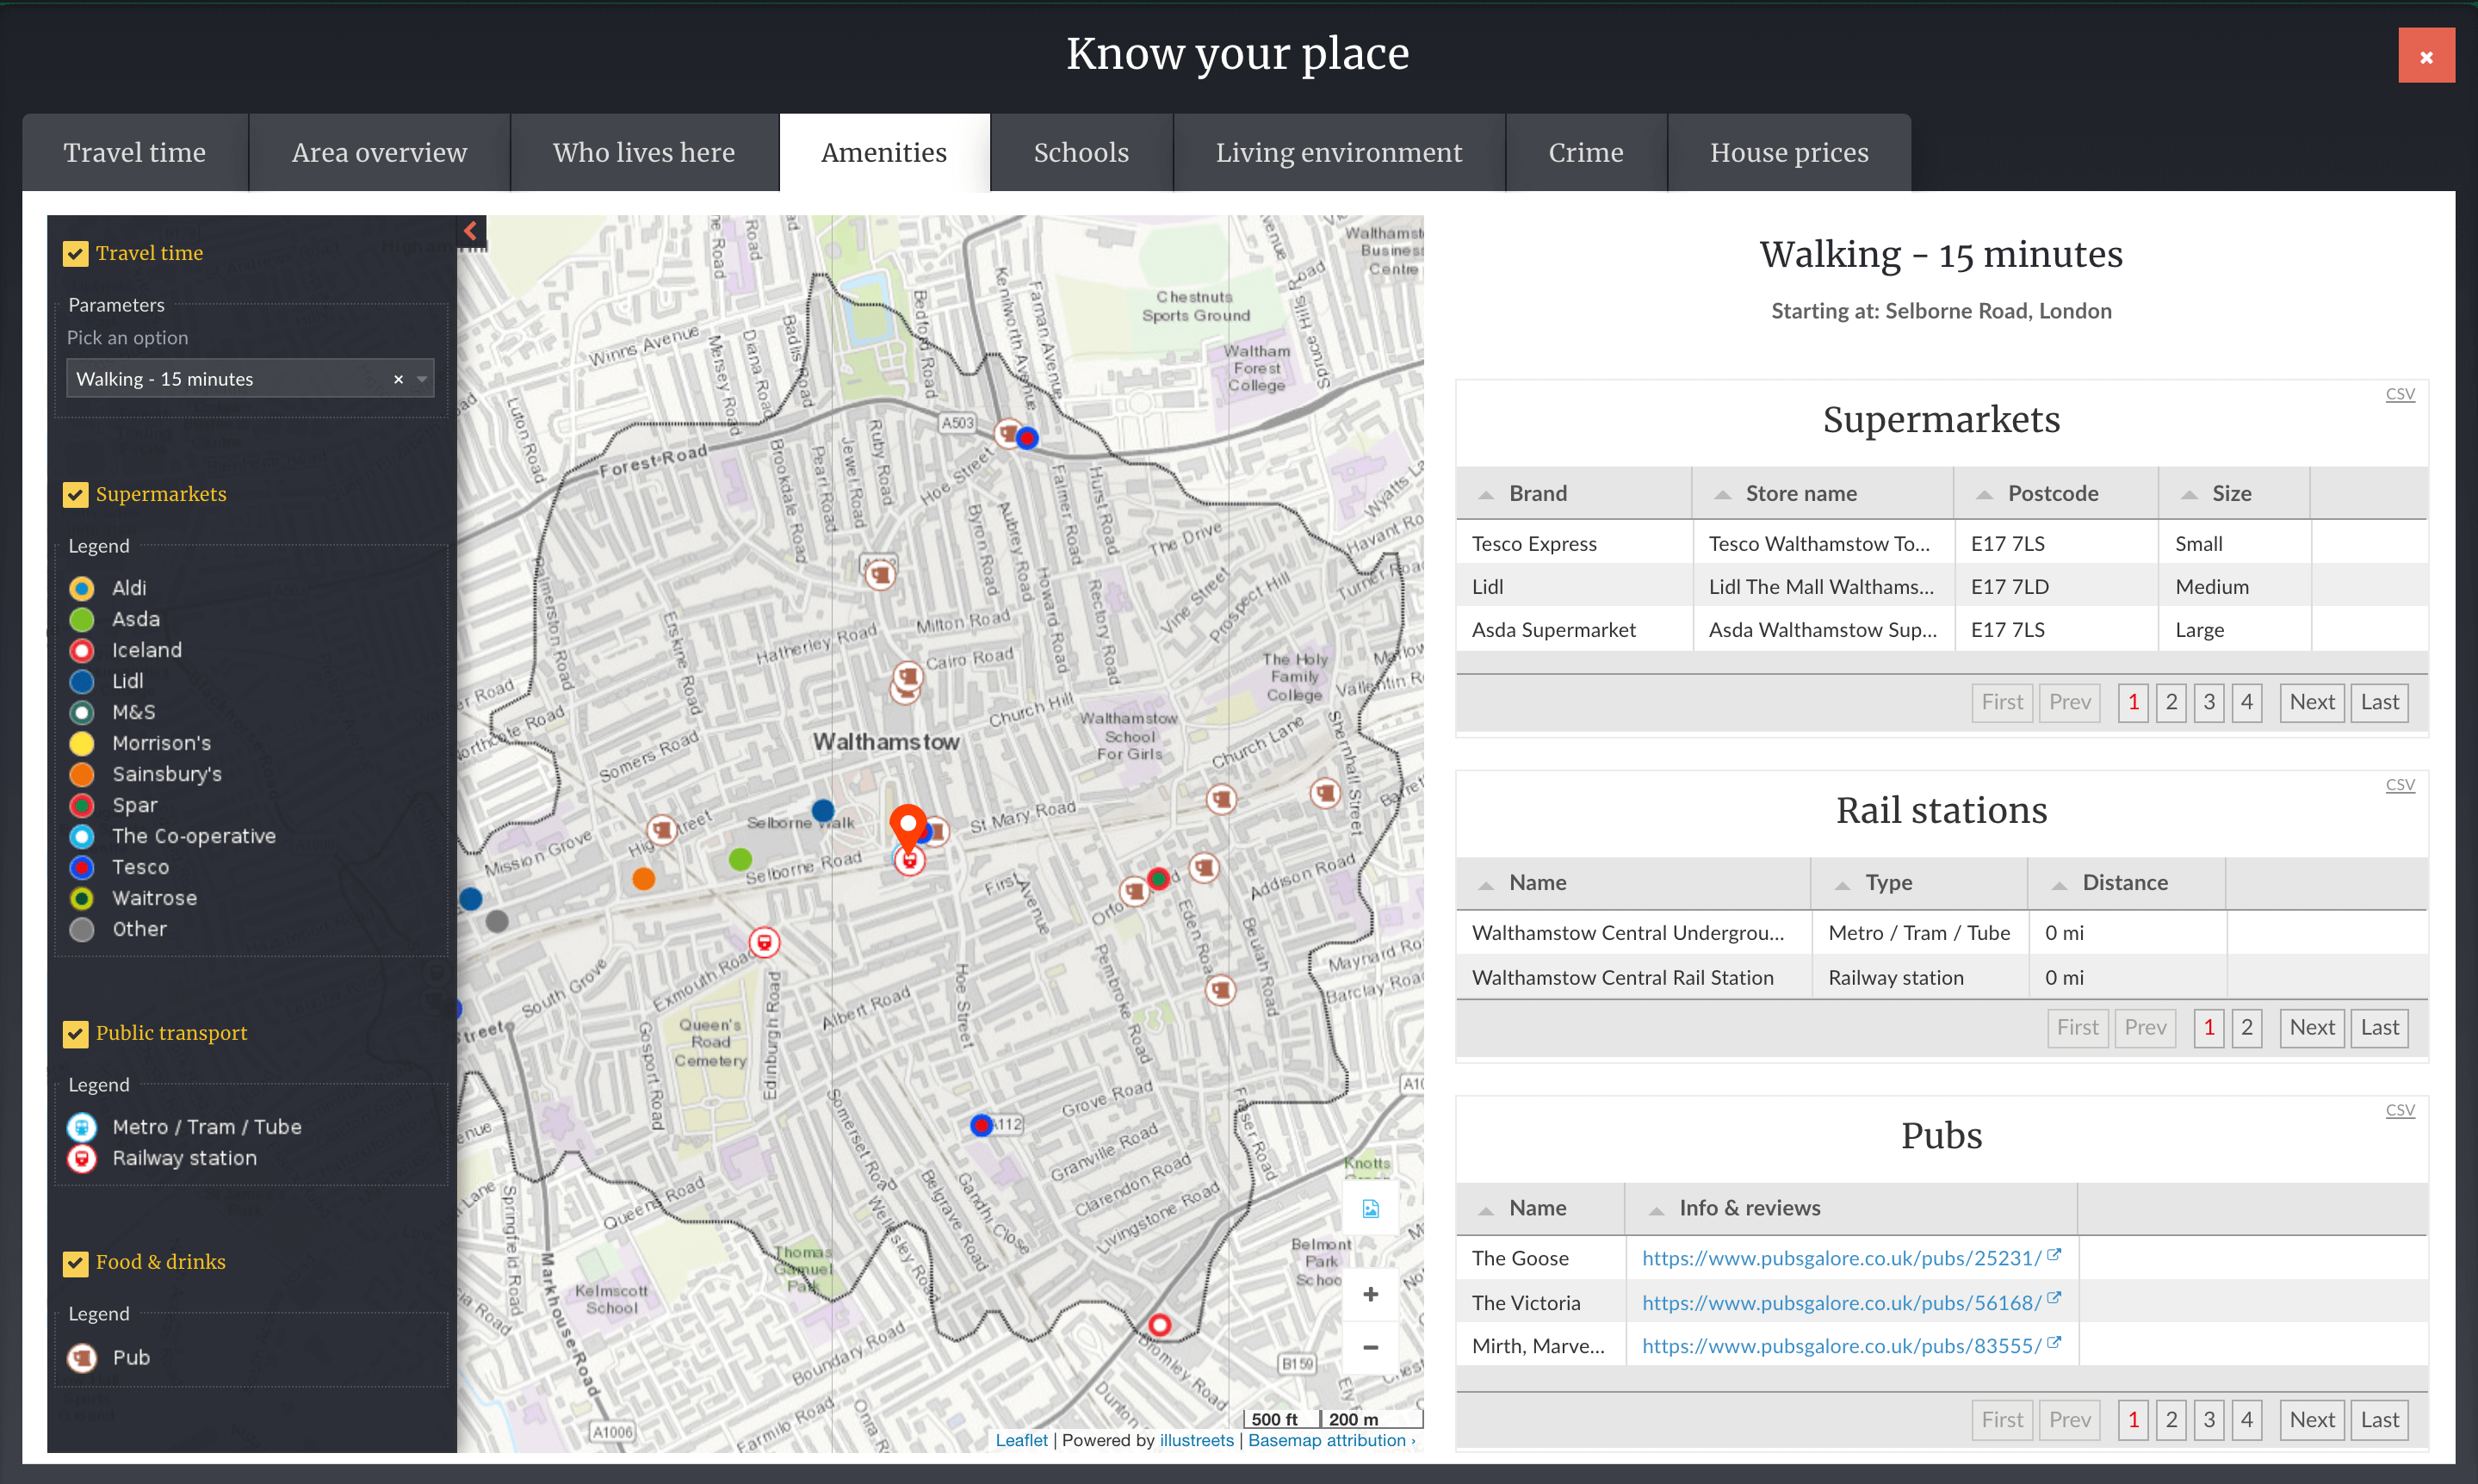
Schools
By default showing schools within 15 minutes of the clicked point. Change the distance by walking or driving using the setting drop-down on the left-side panel.
Schools tab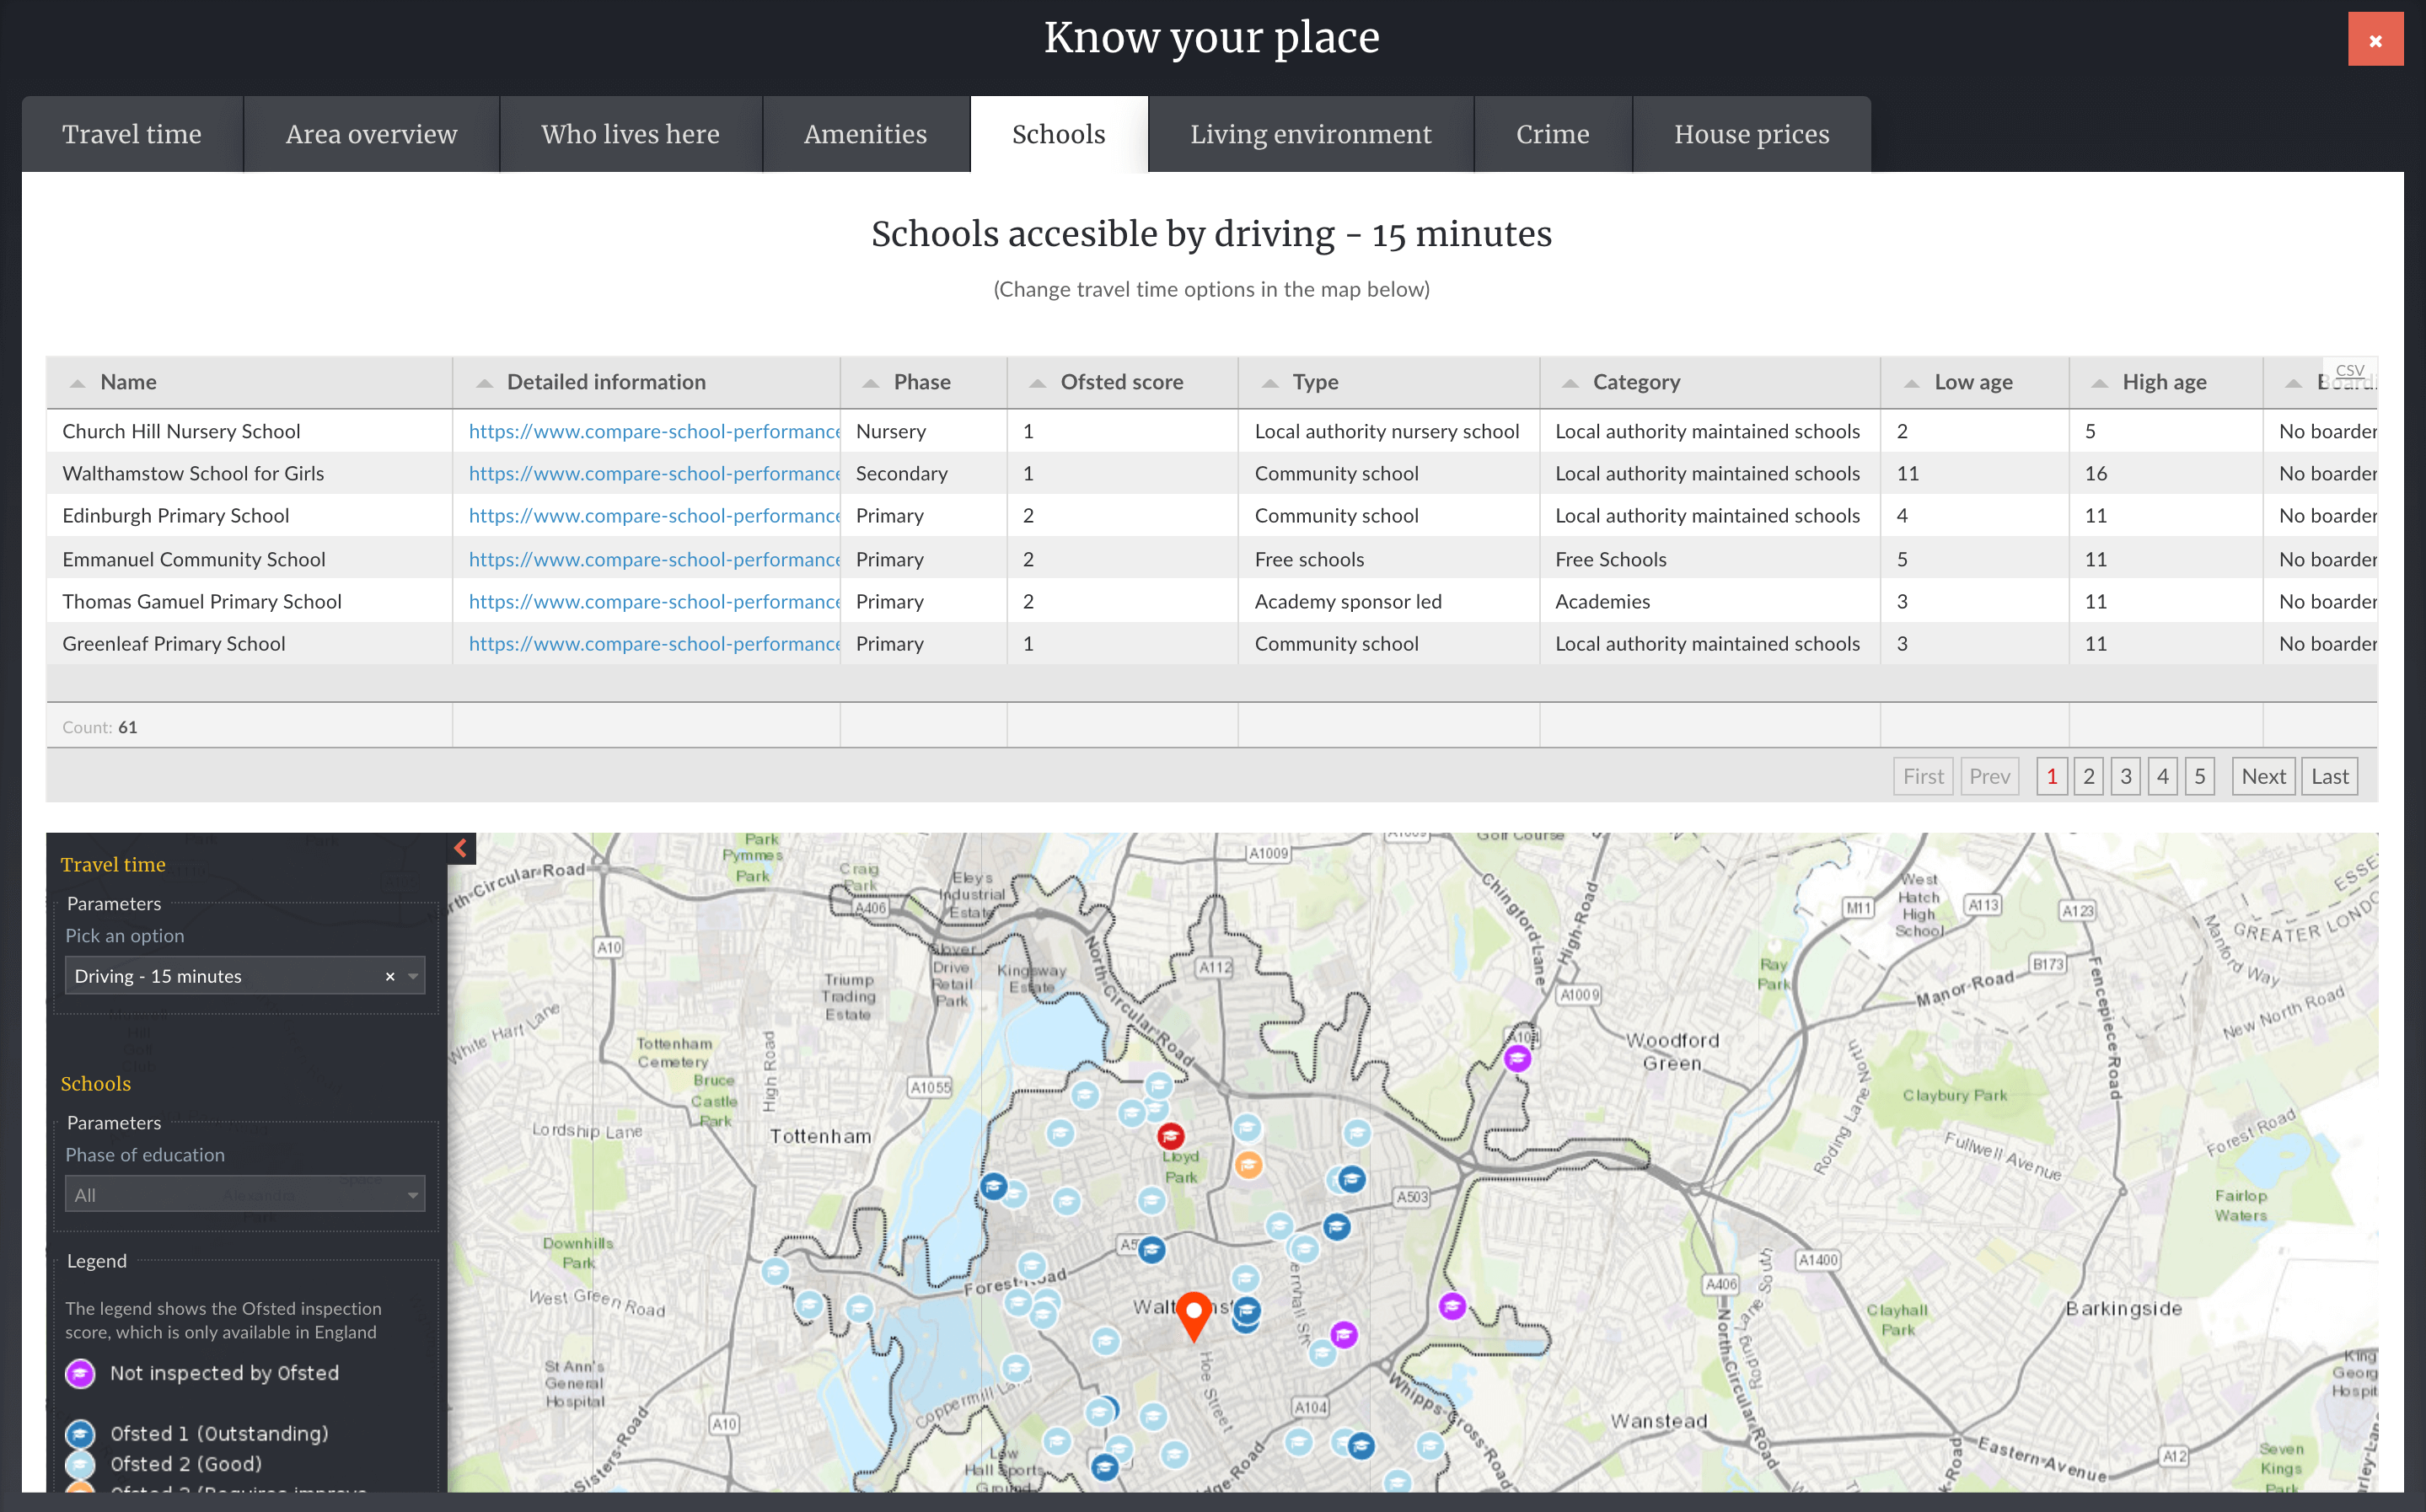
Living environment
- On the left-hand side map you will find green spaces around the point you clicked, from children’s playgrounds, to tennis courts, golf courses and public green spaces per the CRoW Act.
- The right-hand side map is for displaying noise pollution levels from roads and railways, in decibels.
Living environment tab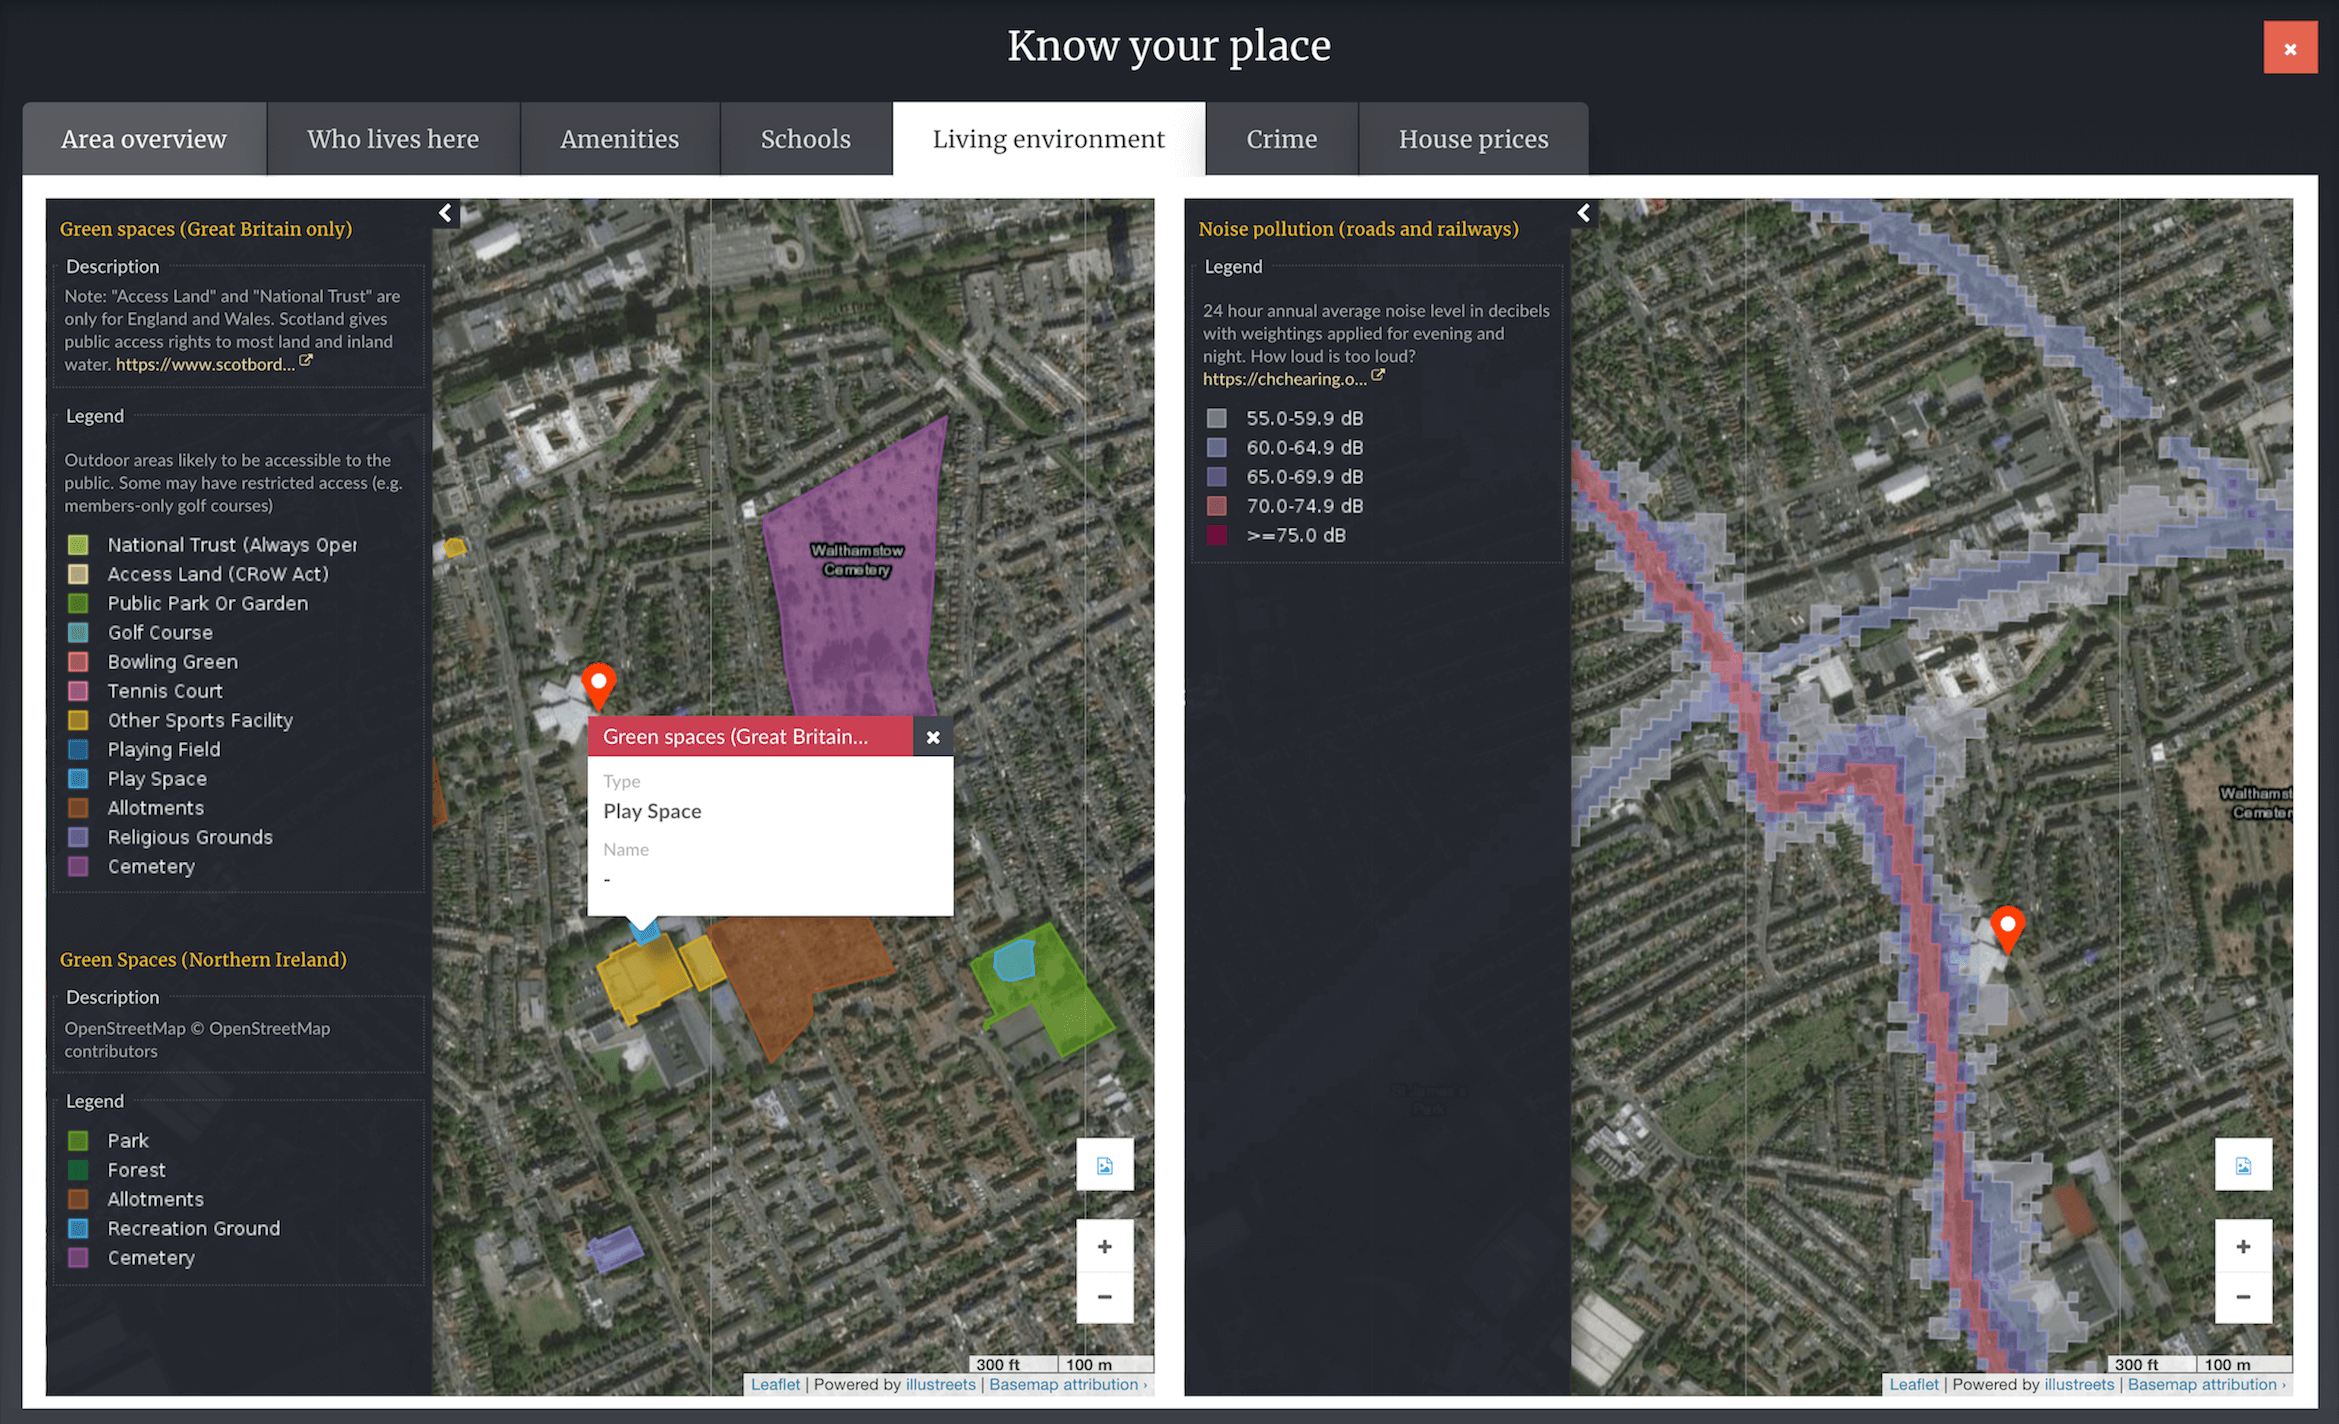
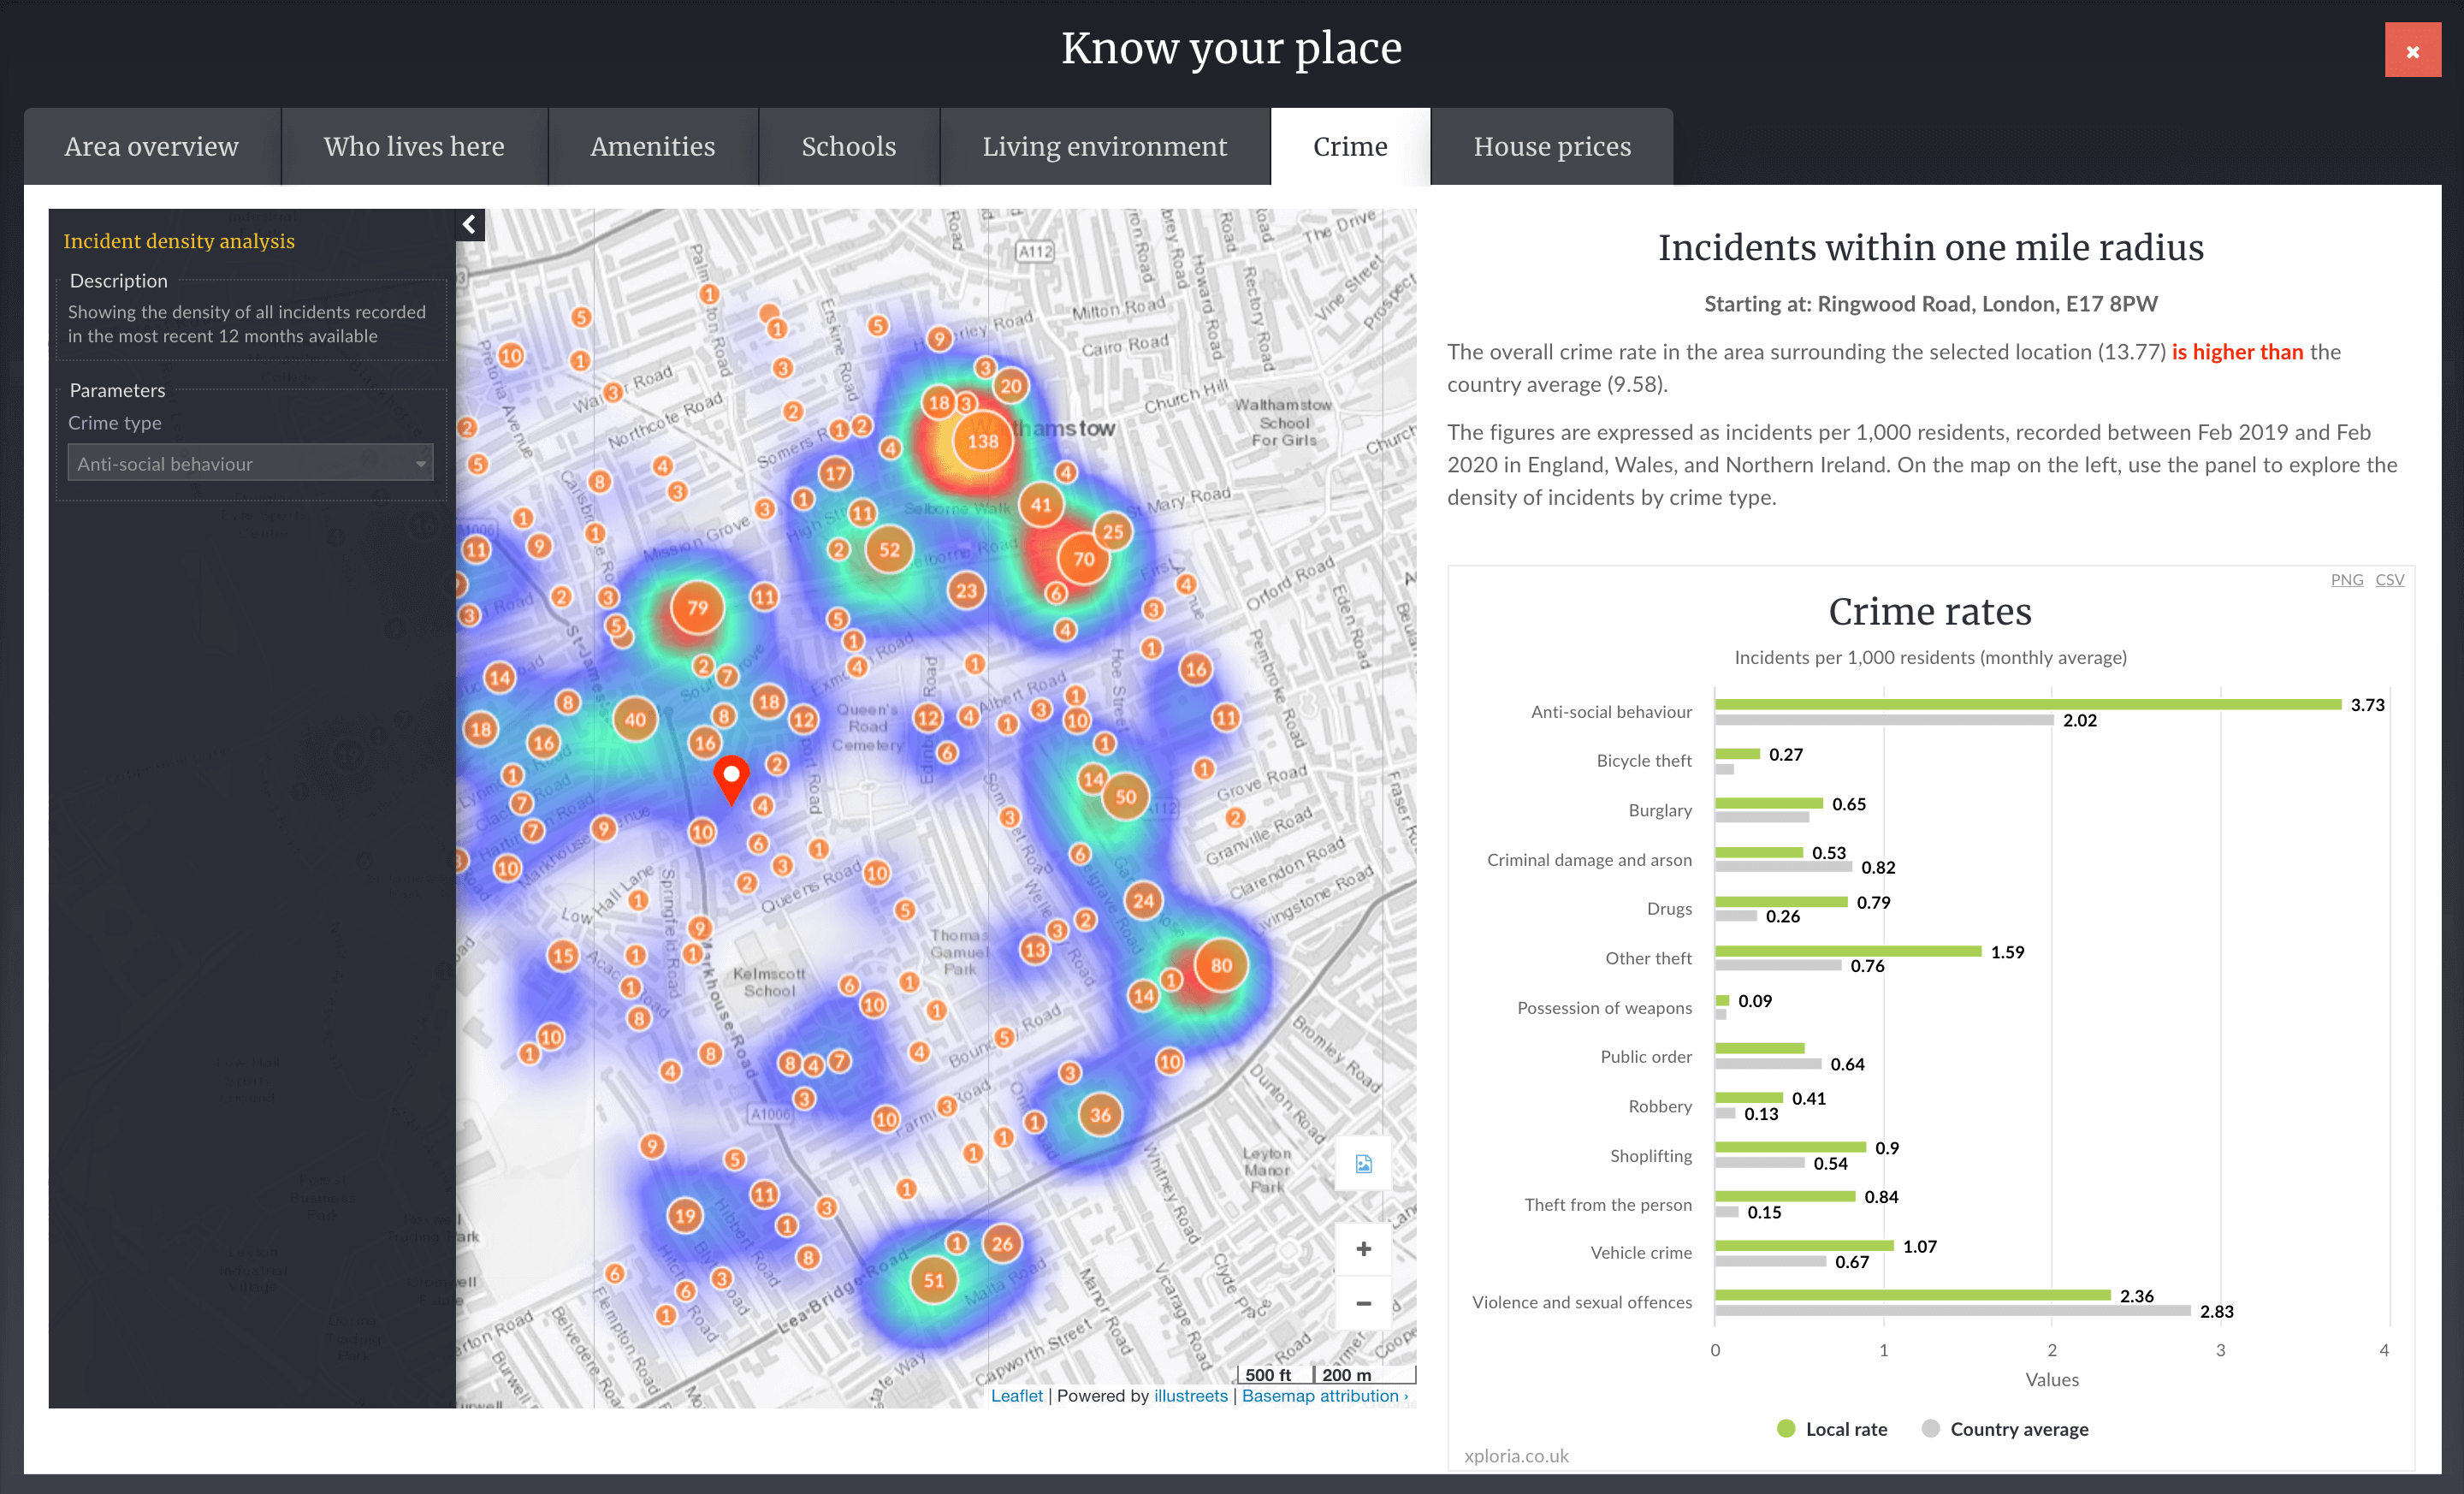
Crime
The crime heat map is set to anti-social behaviour, the most recorded crime by far. To colour the map by other crimes, use the filter on the left side panel. The chart on the right shows comparison of crime rates relative to national averages.
Crime tab